info@nycdatascience.com
917-383-2099
	
NYC Data Science Academy
Bootcamps
Lifetime Job Support Available Financing Available
Bootcamps
Data Science with Machine Learning Flagship 🏆 Data Analytics Bootcamp Artificial Intelligence Bootcamp New Release 🎉
Free Lesson
Intro to Data Science New Release 🎉
Find Inspiration
Find Alumni with Similar Background
Job Outlook
Occupational Outlook Graduate Outcomes Must See 🔥
Alumni
Success Stories Testimonials Alumni Directory Alumni Exclusive Study Program
Courses
View Bundled Courses
Financing Available
Bootcamp Prep Popular 🔥 Data Science Mastery Data Science Launchpad with Python View AI Courses Generative AI for Everyone New 🎉 Generative AI for Finance New 🎉 Generative AI for Marketing New 🎉
Bundle Up
Learn More and Save More
Combination of data science courses.
View Data Science Courses
Beginner
Introductory Python
Intermediate
Data Science Python: Data Analysis and Visualization Popular 🔥 Data Science R: Data Analysis and Visualization
Advanced
Data Science Python: Machine Learning Popular 🔥 Data Science R: Machine Learning Designing and Implementing Production MLOps New 🎉 Natural Language Processing for Production (NLP) New 🎉
Find Inspiration
Get Course Recommendation Must Try 💎 An Ultimate Guide to Become a Data Scientist
For Companies
For Companies
Corporate Offerings Hiring Partners Candidate Portfolio Hire Our Graduates
Students Work
Students Work
All Posts Capstone Data Visualization Machine Learning Python Projects R Projects
Tutorials
About
About
About Us Accreditation Contact Us Join Us FAQ Webinars Subscription An Ultimate Guide to
Become a Data Scientist
Apply Now
NYC Data Science Acedemy
Bootcamps
Courses
Students Work
About
Bootcamps
Bootcamps
Data Science with Machine Learning Flagship
Data Analytics Bootcamp
Artificial Intelligence Bootcamp New Release 🎉
Free Lessons
Intro to Data Science New Release 🎉
Find Inspiration
Find Alumni with Similar Background
Job Outlook
Occupational Outlook
Graduate Outcomes Must See 🔥
Alumni
Success Stories
Testimonials
Alumni Directory
Alumni Exclusive Study Program
Courses
Bundles
financing available
View All Bundles
Bootcamp Prep
Data Science Mastery
Data Science Launchpad with Python NEW!
View AI Courses
Generative AI for Everyone
Generative AI for Finance
Generative AI for Marketing
View Data Science Courses
View All Professional Development Courses
Beginner
Introductory Python
Intermediate
Python: Data Analysis and Visualization
R: Data Analysis and Visualization
Advanced
Python: Machine Learning
R: Machine Learning
Designing and Implementing Production MLOps
Natural Language Processing for Production (NLP)
For Companies
Corporate Offerings
Hiring Partners
Candidate Portfolio
Hire Our Graduates
Students Work
All Posts
Capstone
Data Visualization
Machine Learning
Python Projects
R Projects
About
Accreditation
About Us
Contact Us
Join Us
FAQ
Webinars
Subscription
An Ultimate Guide to Become a Data Scientist
Tutorials
Data Analytics
  • Learn Pandas
  • Learn NumPy
  • Learn SciPy
  • Learn Matplotlib
Machine Learning
  • Boosting
  • Random Forest
  • Linear Regression
  • Decision Tree
  • PCA
Interview by Companies
  • JPMC
  • Google
  • Facebook
Artificial Intelligence
  • Learn Generative AI
  • Learn ChatGPT-3.5
  • Learn ChatGPT-4
  • Learn Google Bard
Coding
  • Learn Python
  • Learn SQL
  • Learn MySQL
  • Learn NoSQL
  • Learn PySpark
  • Learn PyTorch
Interview Questions
  • Python Hard
  • R Easy
  • R Hard
  • SQL Easy
  • SQL Hard
  • Python Easy
Home > Data Science Courses > Data Science with Tableau
Beginner
Data Science with Tableau

Data Science with Tableau

This course offers an accelerated intensive learning experience with Tableau – the growing standard in business intelligence for data visualization and dashboard creation. Without prior experience, students will learn to work with multiple data sources, create compelling visualizations, and roll out their data science products for continuous, scalable outputs to key stakeholders. By building insight and weaving narrative, students will be empowered to harness data in a striking way that provides value to organizations large and small.

All courses are hosted online.

Course Dates

Find out more information about our professional development courses.
DOWNLOAD COURSE INFORMATION
  • Description

Product Description

Course Overview

How can data visualizations be standardized and pipelined for viewing by key decision makers & analysts across an organization? Made to be compelling, informative, and appealing to the eye? Draw upon data sources as various as relational database servers (e.g. SQL), spreadsheets (e.g. Google Sheets), Salesforce, or web-based data? Process ‘big data’ in a live manner for the most up-to-date output? Through our accelerated introduction, students will become fluid in using Tableau’s features to achieve all of these objectives.

This course offers an accelerated intensive learning experience with Tableau – the growing standard in business intelligence for data visualization and dashboard creation. Without prior experience, students will learn to work with multiple data sources, create compelling visualizations, and roll out their data science products for continuous, scalable outputs to key stakeholders. By building insight and weaving narrative, students will be empowered to harness data in a striking way that provides value to organizations large and small. We utilized 4 user cases drawn from finance (public data from major stock exchanges) and sitcom data (Game of Throne 1 ).

This course robustly covers 90-95% of what’s needed for the qualified associate Tableau Certificate.

Prerequisites

Know how to use Mac, Windows. Familiarity with relational databases will be nice but not required:

  • gain a greater appreciation for the logic underlying Tableau’s features
  • utilize their capstone project to visualize ‘big data’ by accessing a variety of server- or cloud-based sources
  • Before the course begins, pre-work will be available for students interested in strengthening their ability to access and extract data from relational databases (e.g. SQL-based servers).

Certificate

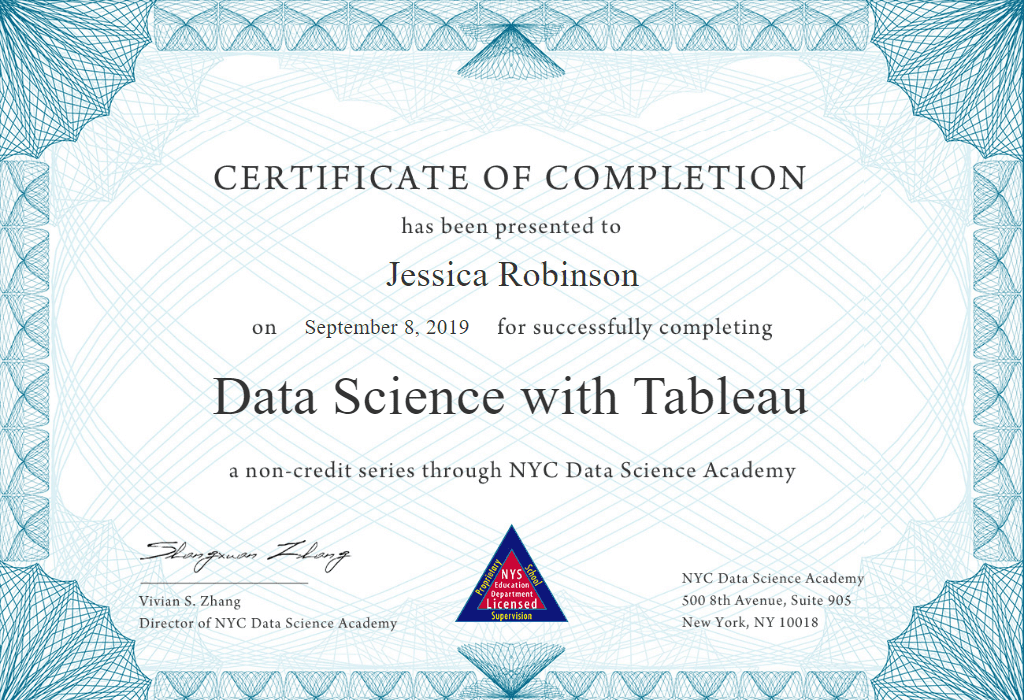
Certificates are awarded at the end of the program at the satisfactory completion of the course. Students are evaluated on a pass/fail basis for their performance on the required homework and final project (where applicable). Students who complete 80% of the homework and attend a minimum of 85% of all classes are eligible for the certificate of completion.
Syllabus

Week 1

  • Importance of Tableau and How It Fits With Computing, Learning, & Analysis Today
  • Connecting with Data & Using Multiple Sources (Relational Logic, Joining, Blending)
  • Organizing your Data (Sorting, Filtering, Hierarchies, Groups, Subsets, Labeling, Aggregation)
  • Measures in View (Individual/Blended/Dual Axes, Cross-tabs, Highlight Tables, Reference Lines)

Week 2

  • Calculations in Tableau (Calculation Syntax & Functions, Level of Detail)
  • Creating and Using Parameters To Power Interactive Visualizations
  • Visualizing Relationships Between Numerical Values (Scatter Plots, Heat Maps)
  • Visualizing Breakdowns of the Whole (Boxplots, Tree Maps, Donut Chart, Sunburst Diagrams)

Week 3

  • Visualizing Structure, Relationships, & Trends through Machine Learning (Clustering, Regression, Forecasting, Integrating R Libraries)
  • Mapping Data Geographically
  • Bringing Together Visualization To Offer Insight & Narrative (Dashboards, Stories)

Week 4

  • Develop capstone project using your own data and have your own goal
  • Project deliverable sheet

Campus Location

500 8th Ave Suite 905, New York, NY 10018
Nearby Subways
1 2 3 34th, Penn Station
A C E 34th, Penn Station
N Q R B D F M 34th, Herald Square
Detailed Directions

Instructor

Wes Aull
Wes Aull
Data Science Instructor
Wes Aull, CPA works as a data scientist/portfolio manager at Economic(a). His research interests include data visualization, time series & harmonic analysis, Bayesian & directional statistics, stochastic processes, and optimization problems.  He earned his M.B.A. from Columbia Business School, Master’s of Professional Accounting from University of Texas-Austin, and B.S. Mathematical Economics from University of Kentucky.
Wes Aull

Session Schedule

Discover more information about learning outcomes, course details, and answers to our frequently asked questions.

By clicking "Download Now", you accept our Terms of Service and Privacy Policy.

Please enter your full name and a valid email address.

Download Now

NYC Data Science Academy

NYC Data Science Academy’s mission is to provide accelerated data science training programs that prepare people for employment as data science professionals and to offer continuing education courses for professional development.

Subscribe to our newsletter and stay posted!

Please enter a valid email address
Sign up completed. Thank you!

Offerings

  • Home
  • Data Science Bootcamp
  • Data Analytics Bootcamp
  • Artificial Intelligence Bootcamp
  • Professional Development Courses
  • Corporate Offerings
  • Hiring Partners
  • About

  • About Us
  • Alumni
  • Blog
  • FAQ
  • Contact Us
  • Refund and Regulations
  • Join Us
  • Catalog
  • SOCIAL MEDIA

    © 2025 NYC Data Science Academy
    All rights reserved. | Site Map
    Privacy Policy | Terms of Service
    Data Science with Python: Data Analysis and Visualization
    Please enter your email address to continue your enrollment

    Please enter a valid email address

    Continue
    Please enter a valid email address
    Please enter a valid email address
    เว็บตรงลิขสิทธิ์แท้ slotheaven.org ฝากถอนออโต้
    Anekaprediksi69 Kunti69 Kunti69 Kunti69 Kunti69 Kunti69 Kunti69 Kunti69 Kunti69 Kunti69 Kunti69 Kunti69 Kunti69 Gtcbet Gtcbet Gtcbet Gtcbet Gtcbet Gtcbet Gtcbet Gtcbet Gtcbet Gtcbet Gtcbet Gtcbet Gtcbet Gtcbet Gtcbet Gtcbet Gtcbet Gtcbet Gtcbet Gtcbet Gtcbet Gtcbet Gtcbet Gtcbet Gtcbet Slot thailand no 1,Slot gacor hari ini